Earth Science

Earth Clipart

The 2024 SCSP Summer Institute focused on concepts in Earth and Space Science (ESS1 & ESS2). The content of this institute will be repeated in 2030.

The 2019 SCSP Summer Institute focused on Environmental Science (ESS3) and the Environmental Principles and Concepts across Disciplinary Core Ideas. The content of this institute will be repeated in 2025.


Conceptual Flows: Earth and Space Science 

Our conceptual flows are diagrams that show one way that scientific concepts within a specific disciplinary core idea can connect and build. These diagrams include concepts from kindergarten through eighth grade and help guide our instruction for each Summer iInstitute. 


Conceptual Flow Diagram

Disciplinary Core Ideas

NGSS Performance Expectations

Click on linked PEs to see corresponding lessons.

Year Presented

Earth's Place in the Universe

ESS1: Earth's Place in the Universe

  • ESS1.A: The Universe and its Stars
  • ESS1.B: Earth and the Solar System
  • ESS1.C: The History of the Planet Earth

ESS2: Earth's Systems

  • ESS2.D: Weather and Climate

1-ESS1-1, 1-ESS1-2

3-ESS2-1, 3-ESS2-2

5-ESS1-1, 5-ESS1-2

7th and 8th Grade PEs:

MS-ESS1-1, MS-ESS1-2, MS-ESS1-3

Earth Science

Summer 2024

Earth's Systems

ESS1: Earth's Place in the Universe

  • ESS1.C: The History of the Planet Earth

 ESS2: Earth's Systems

  • ESS2.A: Earth Materials and Systems
  • ESS2.B: Plate Tectonics and Large-Scale System Interactions
  • ESS2.C: The Roles of Water in the Earth's Surface Processes
  • ESS2.D: Weather and Climate
  • ESS2.E: Biogeology

ESS3: Earth and Human Activity

  • ESS3.B: Natural Hazards

K-ESS2-1, K-ESS3-2

2-ESS1-1, 2-ESS2-2, 2-ESS2-3

3-ESS2-1, 3-ESS2-2

4-ESS1-1, 4-ESS2-1, 4-ESS2-2
 
5-ESS2-1, 5-ESS2-2
 
 MS-ESS2-4, MS-ESS2-5, MS-ESS2-6
 
7th and 8th Grade PEs:
 
MS-ESS1-4, MS-ESS2-1, MS-ESS2-2, MS-ESS2-3

Earth Science

Summer 2024

Earth and Human Activity

ESS1: Earth's Place in the Universe

  • ESS1.C: The History of the Planet Earth

ESS2: Earth's Systems

  • ESS2.E: Biogeology

ESS3: Earth and Human Activity

  • ESS3.A: Natural Resources
  • ESS3.B: Natural Hazards
  • ESS3.C: Human Impacts on Earth Systems
  • ESS3.D: Global Climate Change

 K-ESS2-2, K-ESS3-1, K-ESS3-3

2-ESS1-1, 2-ESS2-1

3-ESS3-1

4-ESS3-1, 4-ESS3-2

5-ESS3-1

MS-ESS3-3, MS-ESS3-5

7th and 8th Grade PEs:

MS-ESS3-1, MS-ESS3-2, MS-ESS3-4

Enviromental Science

Summer 2019

back to top of page

Lessons: ESS1 - Earth's Place in the Universe

Grade Level

NGSS Performance Expectation(s)

Lesson Title and Description

Lesson Materials

Presenter(s)

1

1-ESS1-1

Shfting Skies

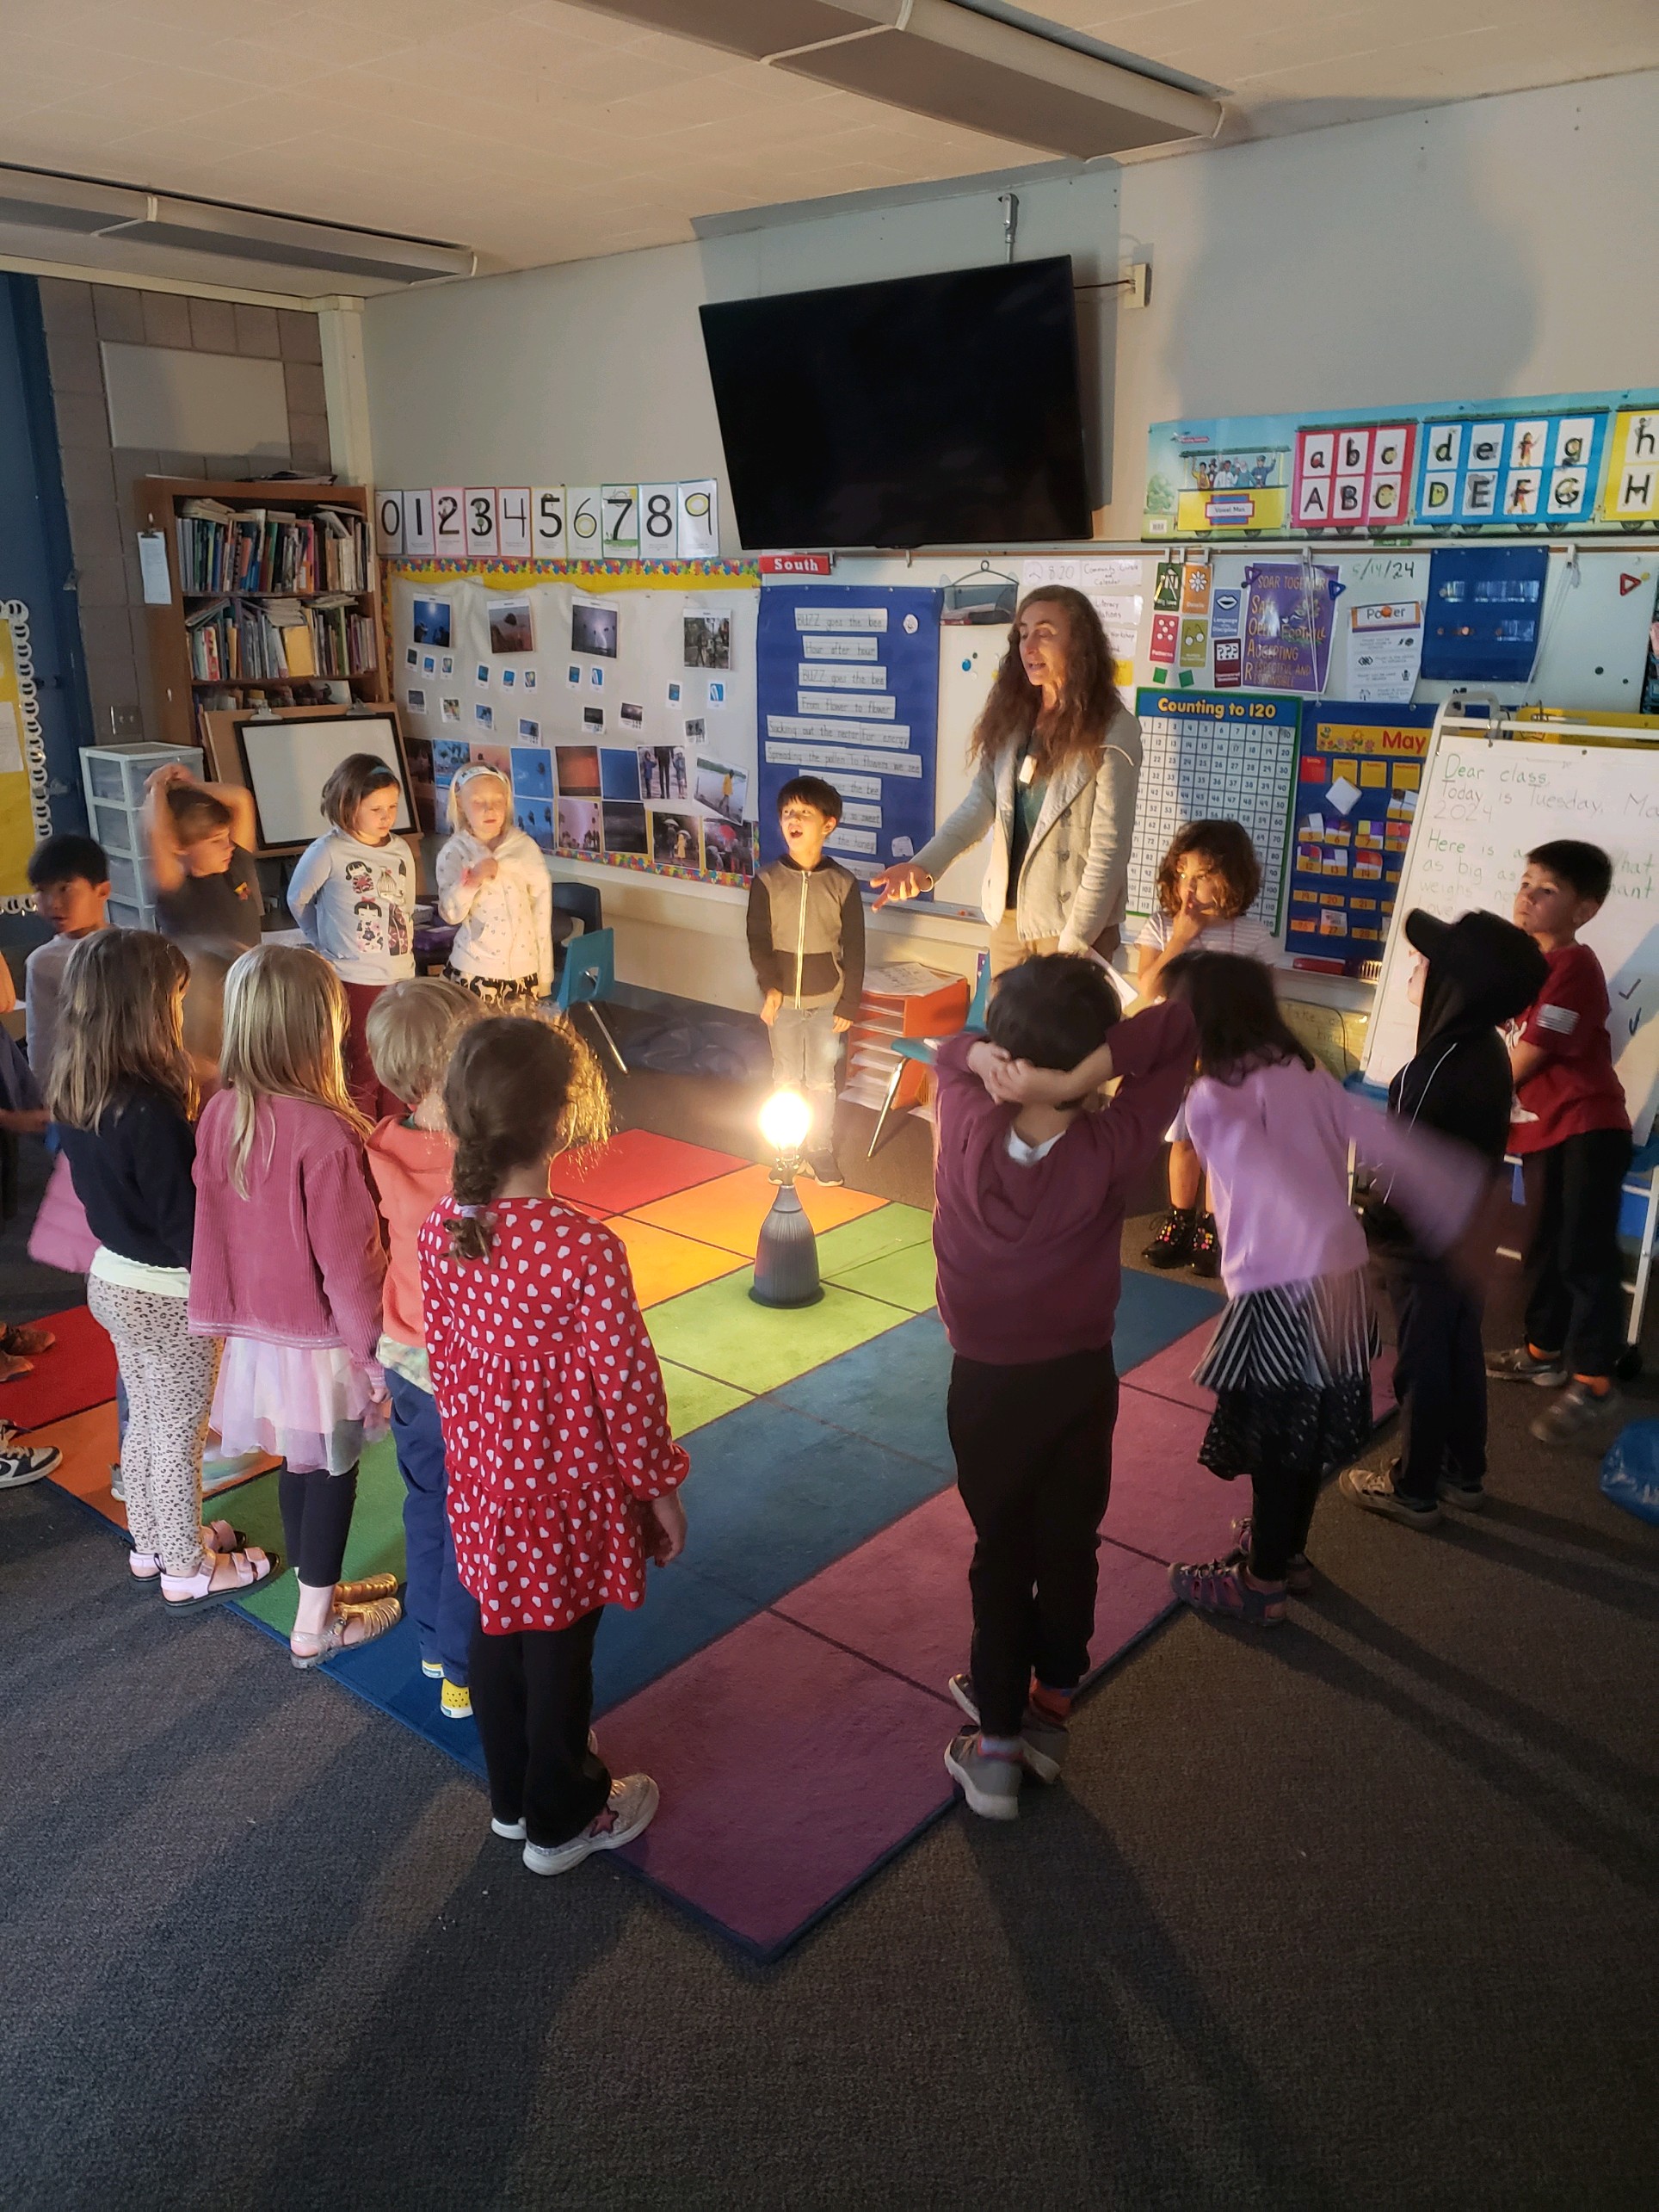
In this lesson, students will observe their shadow and relate the movement of their shadow during the day to the Earth’s rotation. They will also be able to tie the Earth’s rotation to the movement of the Sun across the sky and the day/night cycle. Their explanation will be confirmed by watching a 24-hour time lapse video that shows not only the Sun, but also the Moon. Students will be asked to explain why they observed the Moon move across the sky during the night, which they will be able to relate back to the rotation of the Earth. Students will then be shown pictures of the Moon labeled over the course of 28 days, and will be asked to explain their observations. Students will be led to understand that their current explanation does not explain these observations, and they will come to understand that the Moon must also be moving around the Earth. Students will then use their explanation to predict what the stars will appear to do over the course of 24 hours. To check their prediction, they will watch a time lapse video of the stars. Students will watch an additional video that allows them to see if a camera is focused on one star, they can see the Earth rotating. Students will then be shown pictures of the stars, one taken per month, and generate the explanation that the Earth must be turning to explain this observation. The lesson concludes with students listening to a story about the patterns they were seeing, which will help them to further confirm their explanations.

*Classroom Tested by 2024 Lesson Study Participant*


Lesson Plan

Student Worksheets (Word)

Student Worksheets (PDF)

Additional Materials

Darby Feldwinn

Kandie White

Summer 2024

4 4-ESS1-1

How'd That Get There?

In this lesson, students will make observations of the landscape of the Grand Canyon and then construct an explanation using fossil data for how this landscape has changed over time. They will learn that lower rock layers are older, and fossils found in those lower rock layers are older. They will also learn that this data can be somewhat skewed due to changes in the landscape over time due to flowing water, earthquakes, landslides, and plate motion.

Lesson Plan

Slide Deck (GSlides)

Student Assessmen

Sammi Lambert

Summer 2024

5


5-ESS1-1


Star Gazing

The lesson starts with students looking at a picture of stars and discussing what they wonder about the picture as well as what they already know about stars. Students then list the stars in the picture based on their brightness. Students learn that a star’s brightness can be measured in two different ways: the actual brightness (brightness from a fixed distance) and apparent brightness (brightness from Earth). Students are broken into groups of four students and given cards with facts about stars including, the Brightness From Earth, Actual Brightness, Number of Stars in the System, and Distance From Earth. These cards are used to evaluate claims about what causes stars to appear the brightness they do from Earth. After each claim, students write a statement about if they agree or disagree with the claim and why, and then, in their groups vote on which statement is the strongest. Each group statement is presented to the class and a discussion is had to identify if the argument is valid and strengths and weaknesses within the argument. Students learn that arguments are the best when they are supported with appropriate data. By the end of the activity, students discover that a star’s Brightness From Earth is a combination of the star’s Actual Brightness and its Distance From Earth.


Lesson Plan

Student Worksheets (PDF)

Star Facts Cards (powerpoint)

Star Gazing Stars Slide (powerpoint)

Darby Feldwinn

Summer 2024


back to top of page

Lessons: ESS2 - Earth's Systems

Grade Level

NGSS Performance Expectation(s)

Lesson Title and Description

Lesson Materials

Presenter(s)

TK

K-ESS2-1

What's the Weather?

In this lesson students will explore the local weather patterns on sunny, cloudy, foggy, rainy, stormy, and windy days. They will also learn how to analyze and interpret a month long calendar and a bar graph to see what the most common and least common local weather patterns are. Through guided discussions, students will also analyze and interpret the local weather of Big Bear, California to find the most and least common weather patterns.

Lesson Plan

30-Day Student Journal (GDoc)

Additional Lesson Materials

Sammi Lambert

Summer 2024

2

2-ESS2-2


What's New at the Slough?

Students will make claims about what causes the water level in a local slough to fluctuate. They will complete a map of the slough, and will compare and contrast the structure and function of a slough and a pond. They will gather evidence from informational texts, videos, and demonstrations to revise and support their claims. Students will engage in argument, evaluate competing claims and use evidence to support and refute claims.


Lesson Plan

Student Worksheets (G Doc)

Additional Lesson Materials

Patty Malone

Summer 2024


3

3-ESS2-2

Climates in our Country

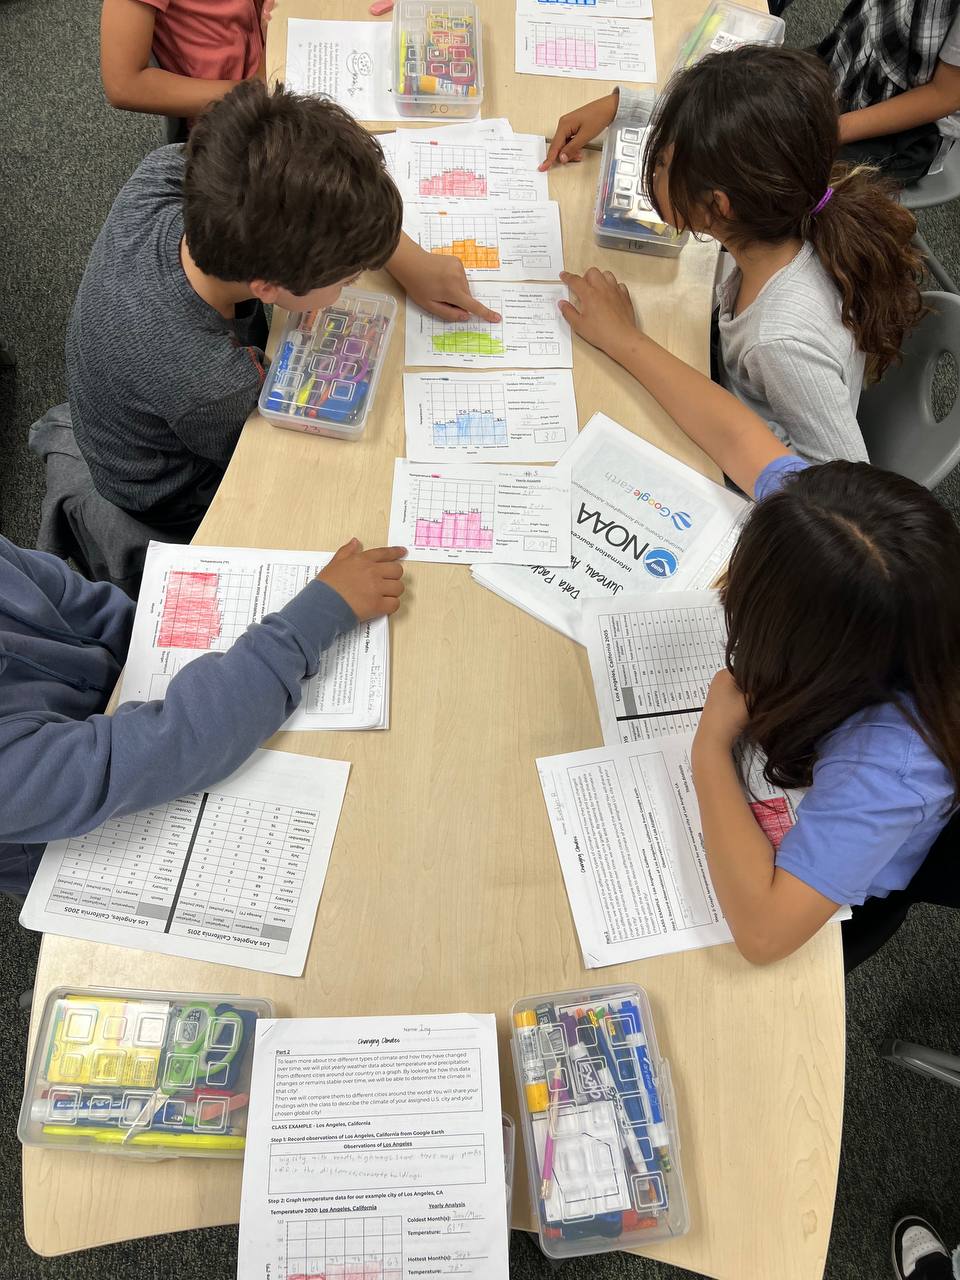
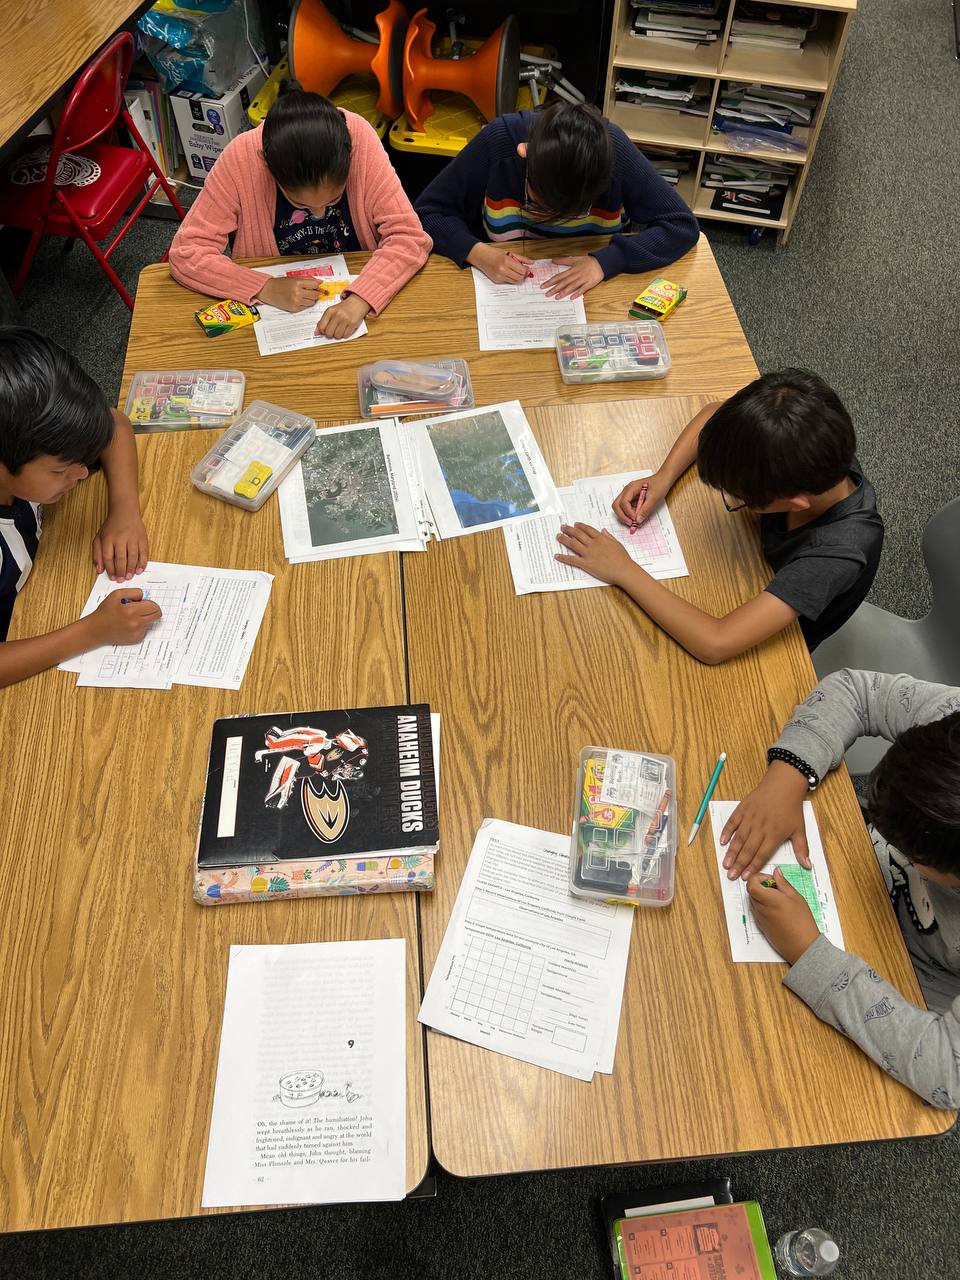
In this lesson, students will be presented with weather (precipitation and temperature) data for an example city of Santa Barbara (this can easily be switched out to your city) and an assigned city. They will graph this data with support and analyze their graphs to determine how the weather has changed over a 25 year time period. Additionally they will construct a class map with all of their assigned cities’ data. They will combine this information with knowledge gained from a short story to learn about the Köppen climate classification system and classify each city as one of the five main climate types. Lastly, they will compare their assigned city to data for global cities to propose a vacation for families who are looking to experience a certain climate type. They will put all of this together in a short presentation that they will present to their class.

*Classroom Tested by 2024 Lesson Study Participant*

"This was a thoroughly engaging lesson that my students really enjoyed. They particularly enjoyed presenting their data. This lesson incorporated a great way to bridge science with math concepts through graphing." - Marla from Garden Grove Unified School District


Lesson Plan

Student Worksheets (GDoc)

Student Presentation Handouts

Data Packets

Additional Lesson Materials

Sammi Lambert

Summer 2024

4

4-ESS2-2

Human Impact

Students will investigate the question, “How has human activity impacted different ecosystems?” Students will complete a simulation in which they will be deer and need to forage for a year’s worth of food both with and without human influence. After the simulation, the students discuss the results and why they are significant to the scientific community. Students will build on the concepts in the simulation by comparing map images of one area from two different time periods. From the maps they will identify what changes occurred to the land because of humans. Students will then apply that knowledge to a new ecosystem and draw what they think will happen in an ecosystem based on the projected increase in human population.

*Classroom Tested by 2019 Teacher Participant Mini-Grant Recipient*

"This investigation had some set up, counting out 'deer food' (pasta) and measuring the 'home range' (space of our field), but 4th graders can easily assist with this part... The forest ecosystem model was very exciting and a great opportunity for the students to engage in the investigation... The students were very intrigued by the before and after pictures [of New Mexico] and doing the geography... Predicting human impact was an interesting way to wrap this up... Overall, this was a great lesson and the hands on approach with the deer food got the students very excited while learning about the human impact on our world." -- Janet from Mound School


Lesson Plan

Student Worksheets (Word)

Student Worksheets (PDF)

Map Images

Lauri Dahlin

Nichole Hughes

Summer 2019

6 / MS

MS-ESS2-4

Water Wonderland

In this lesson, students will develop a model of the water cycle. Part 1 of the lesson starts with students thinking about why water is important to us, where we find water in the environment, and how water enters and leaves these water sources. Groups then generate an initial model containing the names of the water sources (ex: lake), arrows showing the flow of water, and at least the following scientific terms: precipitation, evaporation, solid, liquid, gas, and condensation. In Part 2 of the lesson, students watch two demonstrations that allows them to explore gravity and what happens when rain lands on a slope. They are introduced to ground water and the at least the following scientific terms: gravity, percolation, infiltration, and runoff. These ideas and terms are added to their models in addition, students highlight arrows in green in which gravity plays a role in the transportation of the water. Part 3 of the lesson, student watch another demonstration that allows them to explore the role of heat sources and sinks in the water cycle. Groups revise their model by adding orange arrows to show energy transfer during the water cycle. In addition, they add at least the following scientific terms to their model: humidity, melting, freezing, heat sources, and heat sinks. Part 4 of the lesson allows students to revisit the role of phase changes in the water cycle. Then they explore the role of plants and animals in the water cycle. Groups then add at least the following scientific terms to their model: transpiration and respiration. For Part 5 of the activity, students use their model to make a prediction to explain what happens when we pump groundwater. As a class, students complete a reading that allows them to learn about the local water system, verify their model, and check their prediction about pumping groundwater. This reading introduces the following scientific terms that students will add to their final model: watershed, sea level, aquifer, water table, sublimation, photosynthesis and deposition. The lesson concludes with groups adding the additional terms to their models and sharing their completed water cycle models with the class.

Lesson Plan

Student Worksheet (Word)

Student Worksheet (pdf)

Student Reading (Word)

Student Reading (pdf)

Darby Feldwinn

Hattie Elison

Summer 2024

back to top of page


Lessons: ESS3: Earth and Human Impact

Grade Level

NGSS Performance Expectation(s)

Lesson Title and Description

Lesson Materials

Presenter(s)

K

K-ESS3-1

What Organisms Need

In this six-day lesson, students will examine several ecosystems and learn about what the plants and animals in those environments need to survive. The term FWARPS (FODD, Water, Air, Reproduction, Protection, and Shelter) will be used throughout the lesson with hand motions to jog their memory of said needs. Students will learn about the plants and animals in four different ecosystems and begin notice a familiar pattern of (FWARPS) needs regardless of the type of plant or animal organism it is or the place in which they live. Students will develop a model of understanding and make connections between the needs of different plants and animals (including humans) and the places they live. They will use this model of understanding to appropriately place plants and animals in a pond ecosystem.

Lesson Plan and Lesson Materials

Student Worksheets (Word)

Student Worksheets (PDF)

Rodney Lee

Summer 2019

K K-ESS3-2

Under the Weather

Students start this unit by listening to a book that introduces them to types of extreme weather including: rainstorms, thunderstorms, heat waves, Santa Ana winds, hurricanes, tornadoes, and blizzards, as well as watching videos of the weather events. Students then review these extreme weather events and determine the weather conditions (temperature [hot/cold], precipitation [wet/dry], and wind amount [wind/calm]) associated with each. On Day 2, students look at pictures of extreme weather events and determine the weather conditions and the type of event pictured. As a class they discuss that not all areas have the same type of extreme weather and determine the extreme weather types in their area (Santa Barbara: rainstorms, thunderstorms, heat waves, and Santa Ana winds). On Day 3 they focus on the extreme weather events in their area. They first learn of the effect that each type of extreme weather can cause (ex: rainstorms cause flooding) and discuss why it is important to be able to know the weather, for example to select appropriate clothing. The class is then shown a picture of an extreme weather event and determines the type of event. One student then selects an item (ex: umbrella) or accessory (ex: sunscreen) from a pile that they would need to wear or use during the event. Students learn the hand signal for the item/accessory. On Day 4 students listen to a book about a girl who wants to be a meteorologist and learn that if you work hard you can get your dream job. The class then listens to a book and watches a video about the tools used in predicting the weather. On Day 5 students review the weather predicting tools, as well as what they are used for. The day concludes with students getting a picture of a local extreme weather event and making a drawing of an activity they could do during the event. On the last day of the lesson, each student is given a picture of an extreme weather event and does a mock weather broadcast to the class using the following sentence frame: I am standing _(student describe what they see in picture)_ Today the weather will be _(put in the weather conditions; ex: hot)_ I would suggest doing _(put in recommended activity)_. The other students in the class mime an item or accessory they would use during the weather event. After which, they guess the severe weather event.

Lesson Plan

Student Worksheet (Slides)

Additional Materials

Lesson Readings

Ashley Griffin

Darby Feldwinn

Summer 2024

3

3-ESS3-1*

3-5-ETS1-2

Levees

In this lesson, students will read and answer questions to learn about levees and their uses. Students will then explore how five materials interact with water. Using these findings, students will design and build a levee in groups. As a class, they will develop an evaluation tool to help them assess three levees based on both cost and performance. The levees will be tested by allowing it to rain on the levee and having water raise to the ½ maximum predicted flood height, followed by the maximum predicted flood height. Students will also discuss how building a levee can have a negative effect on surrounding areas.

Lesson Plan

Student Worksheets (Publisher)

Student Worksheets (PDF)

Additional Lesson Materials

Darby Feldwinn

Summer 2019

5

5-ESS3-1

Restoration Channel Islands Debate

​In this lesson, students obtain and combine information from multiple media sources about ways Santa Barbara County uses science ideas to protect the Channel Islands’ environment and the native and non-native species that live on Santa Cruz Island. To learn about these issues, students will watch a tale from the documentary ​West of the West​ and will be provided with articles from local newspapers. Students will then learn about debatable ideas and use this knowledge to form a debatable question regarding the Channel Islands restoration issues. Students will choose a side of this question to debate, search for evidence to support both their claim and their opponent’s proposed claim, and hold a debate with another group.

Lesson Plan

Student Worksheets (Word)

Student Worksheets (PDF)

Additional Lesson Materials

Nichole Hughes

Summer 2019

6/MS

MS-ESS3-5

Is it Hot in Here?

In this lesson, students will analyze a simulation used to visualize how and when carbon dioxide (CO2) traps heat in the atmosphere. Using data from a graph as well as the simulation, they will understand that CO­2 levels in the atmosphere have been rising, causing the global temperature to increase. In groups, students will analyze one of seven different CO2 factors to determine if their factor is a CO2 source or carbon neutral. They will then give their classmates an informal presentation describing the carbon flow within their factor (including light and heat energy interactions), how their factor influences global CO2 levels, and (if their factor is a source) how to reduce CO2 emissions.

Lesson Plan

Student Worksheets (Publisher)

Student Worksheets (PDF)

Additional Lesson Materials

Sammi Lambert

Janis Spracher

Lisa Lisle

Kyla Rightmer

Summer 2019

back to top of page